Many retirees and would-be retirees are worried about outliving their money. And with good reason: Most don’t know their date of death and, thus, they don’t know how long their money has to last.
To address this risk, which is often referred to as longevity risk, financial planners started using Monte Carlo simulations about 25 years ago to try to make what is an uncertain outcome a little bit more certain.
And they had good reasons for doing so. These simulations, which employ a mathematical technique to model the probability of different outcomes, are used with great success in many other walks of life. Engineers, for instance, might use Monte Carlo simulations to estimate the strength of a bridge under different loads, meteorologists might use them to predict the path of a hurricane, and researchers might use them to model the spread of a disease.
Read: Retiring without millions in the bank? It can be done easily.
In the world of retirement planning, according to Bard, the first known use of Monte Carlo simulations in retirement planning was in 1997, when financial planner Lynn Hopewell published an article in the Journal of Financial Planning titled Decision Making Under Conditions of Uncertainty: A Wake-Up Call for the Financial Planning Profession.
In that article, Hopewell argued that financial planners needed to start using Monte Carlo simulations to give their clients a more realistic view of their retirement prospects.
In the years since, planners responded to Hopewell’s argument and the use of Monte Carlo simulations in retirement planning grew and with good reason.
Consider: Monte Carlo simulations allow financial planners to take into account a wide range of variables that can affect a client’s retirement prospects; Monte Carlo simulations can generate a distribution of possible outcomes, which gives a retiree or preretiree a more realistic view of their retirement prospects; and third, Monte Carlo simulations can be used to test different retirement income strategies, which can help a retiree or preretiree to find the strategy that is right for them.
Of course, like most technology, Monte Carlo simulations have limitations. According to Kitces.com, Monte Carlo simulations: may not fully account for occasional bouts of extreme market volatility; are based on historical data, which may not be a good predictor of future returns; and can be complex and difficult to understand; and are not a substitute for good financial planning. to construct retirement income plans.
Read: Odds Are Retirees Don’t Care About the Odds
Now in in the world of retirement-income planning, the adviser typically uses Monte Carlo simulations to learn the proportion of retirement periods in which a strategy failed to sustain a retiree’s planned withdrawals given the withdrawal policy and the asset allocation, according to Javier Estrada, a finance professor at IESE Business School and author of Retirement Planning: Is One Number Enough?
There is no one-size-fits-all target for this failure rate. Some advisers, for instance, want a plan that fails only 10% of the time, while others shoot for a range of 10% to 25%, and still others are comfortable with plans that fail 50% of the time.
Read: Why 50% Probability Of Success Is Actually A Viable Monte Carlo Retirement Projection.
But no matter the target, the methodology is a generally accepted practice.
“Finding an asset allocation or withdrawal policy that minimizes the failure rate, or results in an acceptable failure rate, is a very common methodology,” said Estrada.
However, Estrada’s research reveals two major flaws in this approach of focusing on a target, such as the failure rate. One, it fails to differentiate between early or late failures during retirement. And two, it doesn’t consider any bequest left behind.
The coverage ratio
To address these flaws, Estrada and Mark Kritzman, the chief executive of Windham Capital Management and a senior lecturer at MIT Sloan School of Management, introduced in a 2019 paper the concept of the coverage ratio, which they said is “a novel metric superior to the failure rate.”
According to Estrada, the coverage ratio simply represents how many years you’ll be able to withdraw your desired amount of money from your retirement accounts to support your lifestyle given your asset allocation and given the number of years you’ll need those withdrawals.
A strategy that sustains withdrawals exactly until the end of the retirement period with no bequest gets a coverage ratio of 1.
A strategy that sustains withdrawals throughout the entire retirement period and leaves a bequest gets a coverage ratio greater than 1.
And a strategy that depletes the portfolio before the end of the retirement period gets a coverage ratio less than 1.
So, for example, consider a 30-year retirement period, a $1,000 retirement portfolio, annual inflation-adjusted withdrawals of $40, and three strategies, each of which might have different stock/bond allocations.
The first strategy depletes the portfolio in 24 years, the second does so in exactly 30 years, and the third sustains withdrawals for 30 years and leaves a bequest of $240, which can support another six years of $40 withdrawals. In this example, the coverage ratios would be 0.8, 1.0, and 1.2, respectively.
In short, Estrada says the coverage ratio considers whether a withdrawal plan falls short, is fulfilled exactly, or exceeds expectations by leaving a bequest.
And the use of the coverage ratio is a far better way to measure whether a retiree’s will last over the course of their lifetime.
Now this approach has its pros and cons.
“The pros are that, unlike the failure rate, the coverage ratio takes into account when a strategy fails; and how large of a bequest is left when the strategy succeeds,” said Estrada. “The main con right now is that the failure rate has a long history and is very widely used, whereas the coverage ratio is new and needs to gain ground and become better known.”
The distribution of coverage ratios
But rather than solely focusing on just one coverage ratio, Estrada is suggesting in his latest paper that retirees and advisers ought to focus on the entire distribution of coverage ratios or specific percentiles that align with their preferences. And that would give retirees a better sense of the best asset allocation and withdrawal strategy to consider given their retirement goals.
To be sure, many approaches have been suggested in the past and many others will most likely be suggested in the future. But the approach Estrada proposed in his paper has, from his point of view, this one big advantage: “It is easy for retirees to understand and for their advisers to explain, and will hopefully help both to make such a critical decision for such an important period of life.”
Now, at the risk of getting too far into the weeds, Estrada proposed in his latest paper calculating a coverage ratio for each (historical or simulated) retirement period considered, and then focusing on the distribution of coverage ratios.
“This,” he wrote, “would enable a retiree or adviser to consider not only the mean (the average) or median (the middle number) coverage ratio for each strategy but also some relevant percentiles of the distribution, such as those extreme scenarios that occur with a low (1%, 5%, or 10%) probability, particularly on the left tail of the distribution.” The left tail being the outliers, the bad and unlikely results where the coverage ratio might be less than 1, for instance.
In this manner, Estrada noted, that the relevant percentiles to focus on and the relative importance given to each would be chosen by a retiree depending on his own preferences.
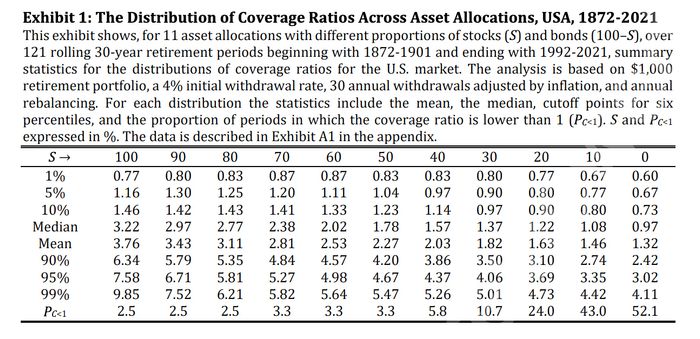
In his research, for instance, he looked at the distribution of coverage ratios across different asset allocations ranging from 100% stocks to 100% bonds using a 4% withdrawal rate (see exhibit 1), as well as the distribution of coverage ratios using different withdrawal rates ranging from 2% to 6% (see exhibit 2).
Source: Retirement Planning: Is One Number Enough? By Javier Estrada

Source: Retirement Planning: Is One Number Enough? By Javier Estrada
And what he discovered in the former case, not surprisingly, is that the mean and median coverage ratios increase as the percentage allocated to stocks increases. And in the latter case, he discovered, not surprisingly, that mean and median coverage ratios steadily decrease as the initial withdrawal rate increases.
Now this approach of looking at the whole distribution of coverage ratios is not as neat as selecting a strategy that maximizes or minimizes the value of a target (such as the failure rate), but it does have, according to Estrada, several desirable traits:
It avoids focusing on just one average figure, which may often be misleading; it considers unlikely scenarios, particularly (outliers); and it makes it possible to weigh different scenarios according to each retiree’s goals and priorities, thus implicitly incorporating preferences.
So, one retiree might prefer a withdrawal rate of 3.5% which has an average coverage ratio of 3.11 while another retiree with different goals and a different risk profile might but prefer a withdrawal rate of 4% which has a smaller coverage ratio of 2.53. In both cases, the retiree would be able to withdraw their desired amount of money from their retirement accounts to support their lifestyle over the course of their lifetime and still leave a bequest. But in the case of the 3.5% withdrawal rate, the coverage ratio provides a bit more certainty than the 4% withdrawal rate.
Ultimately, however, the retiree gets to choose the withdrawal rate or asset allocation that best suits them and their tolerance for risk.
And that’s important.
“The importance of selecting a good, and ultimately optimal, retirement strategy can hardly be overstated,” Estrada wrote. “A retiree’s ability to enjoy the lifestyle planned for retirement, and to leave a bequest if so desired, critically depend on this choice.”
This post was originally published on Market Watch