Nvidia Corp.’s stock chart shows that, after the stock’s continued surge into record territory, it is now technically the most overbought it has been in six months — but that doesn’t mean the rally is over.
In fact, some chart watchers believe the stock’s recent breakout marks the beginning of the next leg of the uptrend, which could propel the stock above the $600 level.
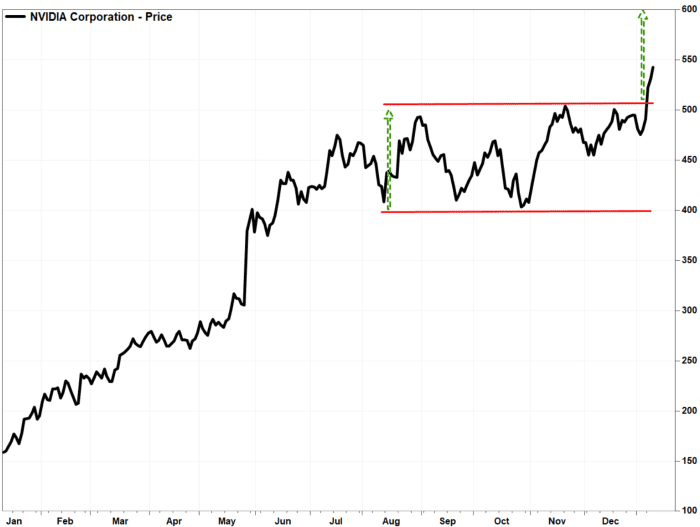
Katie Stockton, technical analyst at Fairlead Strategies, said the breakout was a “bullish medium-term development,” as it resolved a four-month trading range with a definitive up move.
“The breakout resumes [Nvidia’s] long-term uptrend for an initial projection of ~$602,” Stockton wrote in a recent note to clients.
The stock breaks out of a four-month trading range, for an initial target above the $600 level.
FactSet, MarketWatch
The semiconductor and artificial-intelligence play’s stock
NVDA,
rose 2.1% in afternoon trading Wednesday, toward a fifth straight gain and a third straight record close. It has soared 14% over the past five sessions, the best five-day performance since it went up 14.7% over the five-day stretch that ended on June 14.
The rally comes as the company this week announced expanded partnerships with drug-discovery companies and said a number of China-based electric-vehicle makers have chosen Nvidia’s centralized car computer to power their fleets.
Read: Nvidia tops the list of Wall Street’s 20 favorite stocks for 2024
On the stock’s chart, the Relative Strength Index (RSI), a momentum indicator that compares the magnitude of recent gains with the magnitude of losses, has climbed 72.03, according to FactSet data. Many chart watchers believe RSI readings above 70 are a sign of overbought conditions.
Nvidia’s RSI is now at the highest reading since the stock reached 74.77 on July 18.
In addition, the stock is trading 2.5% above the top line of the Bollinger Bands indicator ($529.39), which also suggests an overbought condition.
The Bollinger Bands indicator consists of three lines that are overlaid with the price chart. The middle line is usually a 20-day moving average, and the top and bottom lines are two standard deviations away from the middle line. Read more about Bollinger Bands here.
But keep in mind that while overbought indicators show that Nvidia’s stock has rallied more than what history suggests would be normal, that doesn’t mean the rally is over.
Some observers even interpret some overbought signs as an ability rather than a condition, with the view that the ability to become overbought is a sign of underlying strength.

The RSI indicator shows that Nvidia’s stock is the most overbought since July, but that doesn’t mean the uptrend is over.
FactSet, MarketWatch
And as DataTrek Research co-founder Jessica Rabe wrote, even though Nvidia’s stock is at an all-time high, it has “yet to reach statistically significant overbought levels.”
As the above RSI chart shows, some previous similarly high readings may have prompted brief pauses in the stock’s rally, but they didn’t derail the uptrend.
The same holds for the last times the stock was as far above the top Bollinger Bands line as it is now.

That last times the stock was as far above the top Bollinger Bands line as it is now, there were brief pauses in the rally, but the uptrend continued.
FactSet, MarketWatch
Rabe noted that momentum is a powerful tool. Basically, she said, she won’t be tempted by an unusually big rally into overbought territory to bet on a pullback.
“We stick by our cardinal rule to ‘never short a new high,’” she wrote.
This post was originally published on Market Watch