Wall Street strategists’ outlook for U.S. stocks is more dour than it was during the aftermath of the global financial crisis, according to a sell-side indicator compiled by BofA Global Research.
But rather than being a sign of more pain to come, BofA analysts said such weak sentiment could signal that stocks are poised to build on their first-quarter gains, according to an analysis from a top Bank of America quantitative strategist.
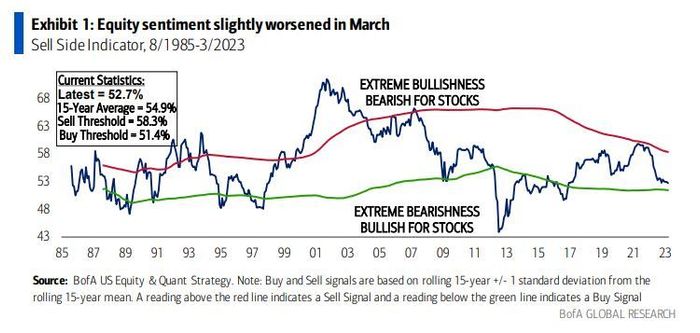
“We have found that Wall Street’s consensus equity allocation has historically been a reliable contrarian indicator,” said Savita Subramanian, head of equity and quantitative strategy at BofA Securities, in a recent research note.
BofA’s “Sell Side Indicator” found that the average recommended portfolio allocation to equities from a group of investment banks declined by nearly a quarter of a percentage point in March to 52.7%.
That’s lower than the average recommended equity allocation from late 2008 and March 2009 (the month that the S&P 500 hit a postcrisis bottom that eventually proved to be the start of a new bull market).
During the intervening years there have been a few instances were the SSI has been lower. But each time, the S&P 500 traded higher 12 months later.
BOFA GLOBAL RESEARCH
“While the SSI does not catch every rally or decline in the stock market, the indicator has historically had some predictive capability with respect to subsequent 12 month S&P 500 total returns,” Subramanian said in the note.
While the SSI only tracks changes in investment banks’ recommended equity allocations, and not the reasoning driving these changes, Subramanian reasoned that the collapse of Silicon Valley Bank and the ensuing selloff in regional lenders likely contributed to banks’ decision to recommend that clients reduce their equity exposure.
U.S. stocks have held up remarkably well in the weeks since SVB was taken into FDIC receivership on March 10 after the bank was closed by the California Department of Financial Protection.
The S&P 500
SPX,
rose 3.5% last month, led by gains for shares of technology companies, particularly megacap names like Microsoft Corp.
MSFT,
Apple Inc.
AAPL,
and Nvidia Corp.
NVDA,
These stocks behaved like safety plays as investors sought out companies with reliable cash flows and strong balance sheets, equity analysts said. Their outsize gains helped the Nasdaq-100
NDX,
enter a fresh bull market after it rose more than 20% off its most recent lows.
This hasn’t stopped Bank of America’s clients from cashing out, however. Clients pulled the most money from stocks last week since October, with $3.2 billion flowing out. It was the first such outflow in five weeks, with institutional and private clients leading the way, according to a weekly report published by BofA Data Analytics.
U.S. stocks traded lower on Tuesday, with the S&P 500 down 0.6%, on track to snap a four-day winning streak. The Dow Jones Industrial Average
DJIA,
was down 45 points, or 0.1%, at 33,556, while the Nasdaq Composite
COMP,
was off by 66 points, or 0.5%, to 12,123.
This post was originally published on Market Watch