After a strong first quarter, the Aviva (LSE: AV.) share price has tapered off, down 4.7% since this year’s high. But over the past year, it’s outperformed the Footsie and is now near a seven-year high.
The shares are trading at £4.73, slightly down from the May high of £4.97.
So where is the stock headed from here?
To find out, I’m charting some key growth metrics that may reveal hidden clues.
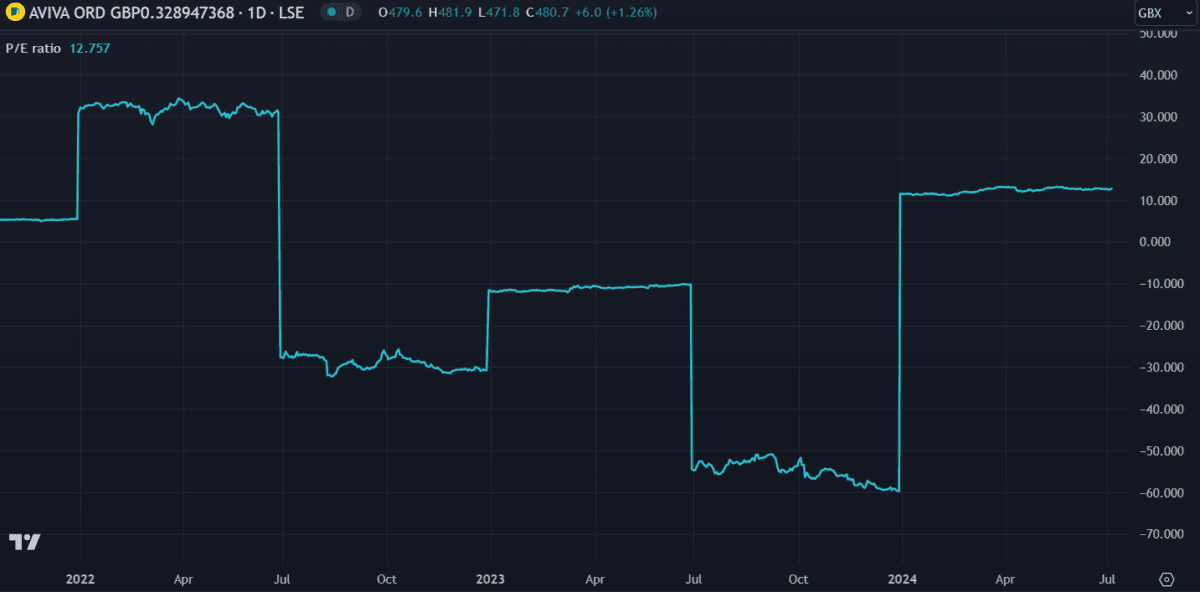
Price-to-earnings
I always check the price-to-earnings (P/E) ratio first to get a rough idea of the value. If the price is a lot higher than earnings the stock could be overvalued, limiting further growth. But a low P/E ratio suggests the price hasn’t caught up with earnings yet and further growth is to be expected.
Currently, the average P/E ratio on the UK market is 18.4, near the highest it’s been in several years. Aviva’s P/E ratio of 12.7 is comparatively low, suggesting the stock has decent growth potential.
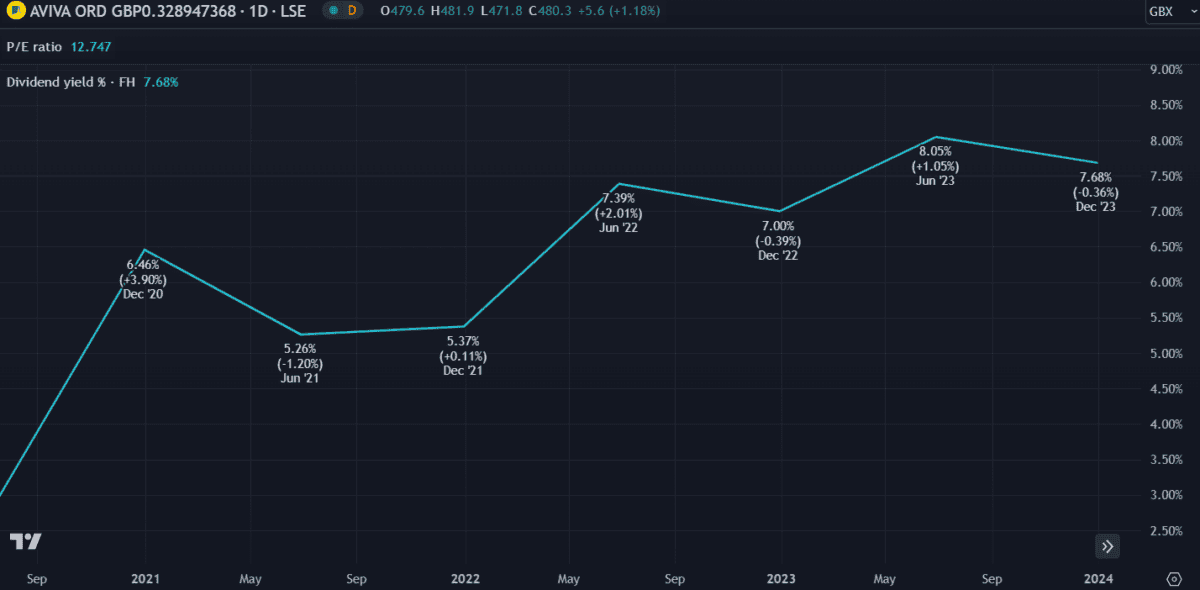
Dividend yield
One of Aviva’s key value propositions is that it’s a known dividend payer. The ability to give back a portion of profits to shareholders is a strong indication that a company is performing well. For the past two decades, it’s paid fluctuating annual dividends of between 15p and 30p per share. Overall, there hasn’t been much growth but payments have been consistent.
The dividend yield indicates what percentage of the current share price is paid annually. Currently at 7.68%, we can see from the chart that it’s been growing consistently since 2021. It’s now the seventh-highest dividend yield on the FTSE 100 — albeit slightly below competitor Legal & General, in fifth place.
Debt
Debt can be very useful to a company if used correctly. In fact, it’s considered a critical part of any successful company’s operations. But when used as a lifeline, it can become a problem. The below chart shows three important metrics: debt, equity, and debt-to-equity (D/E) ratio. We can see that debt has been declining, which is good. However, equity has declined at a faster rate, leading to a rise in the D/E ratio.
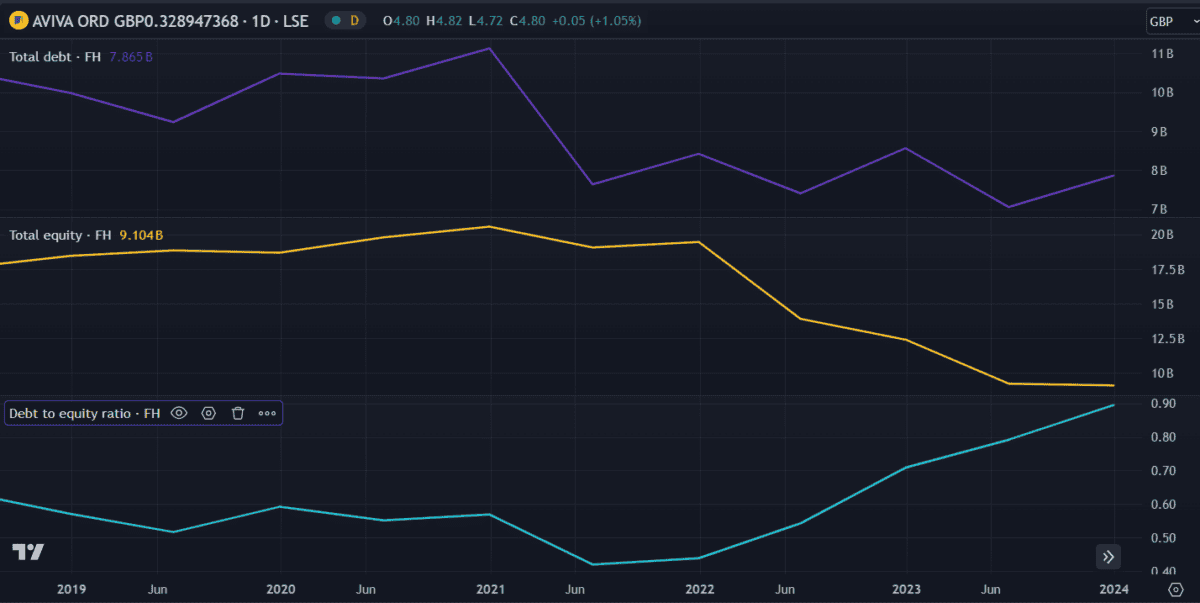
The D/E ratio should ideally remain below one. With Aviva’s now at 0.9, it’s getting dangerously close to having more debt than equity. This is a concerning situation. If a company doesn’t have sufficient equity or cash flow to cover its debt, it may default — or in a worst-case scenario, go bankrupt.
Fortunately, Aviva has a lot of cash and assets, so that’s not a risk for now.
My verdict
Considering the above metrics, the Aviva share price still looks cheap to me. This is reflected in the P/E ratio and supported by future earnings estimates, which calculate it trading at 42% below fair value. But that doesn’t mean it’ll grow.
The UK’s insurance market is cut-throat and Aviva faces many rivals. If an economic recovery is delayed, consumers may seek out cheaper alternatives, threatening profits. With equity declining and debt rising, it can’t afford to lose customers at this crucial point.
On paper, things look good and I think the share price could improve from here. But I wouldn’t expect huge growth. Fortunately, the high dividend yield gives the stock great value either way.
This post was originally published on Motley Fool